Statistics as Psychology: Harry Potter and the Sorcerer’s Stats
Posted February 8, 2017
By Thomas P. Tibbett
In my five-year tenure as graduate student, I’ve asked many students what originally drew them to psychology. To date, none have enthusiastically responded, “Statistics!” If there are students who gush about hand-calculating F-values, they must be attending other schools. More commonly, I get students who say they have (or hate!) to take statistics. All manner of groans, squirming, and eye-rolling follow. They matter-of-factly inform me that they got into this field for the people, not the numbers. They seem to believe that they “don’t need to know this to be successful in psychology!”
Sadly, they do. That said, I don’t blame them for their complaints. Very few students sign up for a psychology major with the end-goal of a quantitative career. Usually, they either want to help people or to understand them (or perhaps even explore themselves.)
Some studies have sought to understand why students come in hating psychology-statistics courses. Researchers often arrive at the explanation that people range greatly in math experience; other experts note greater anxiety as a function of low interest in statistics. Finally, it is possible that beliefs about math ability may play a role; social psychology research suggests women might be anxious about confirming stereotypes (here, being ‘bad at math’)—keeping them from performing at their best. These factors and more can lead students to have a distaste for their required stats course.
In my experience, complaints fall into two general types: “stats class is not fun” and “stats class is not useful to me.” It’s challenging to address these grievances, largely because of the way courses are designed. Even the labs, which should be more hands on and engaging are a source of frustration or boredom for many students.
Harry Potter and the Sorcerer’s Stats
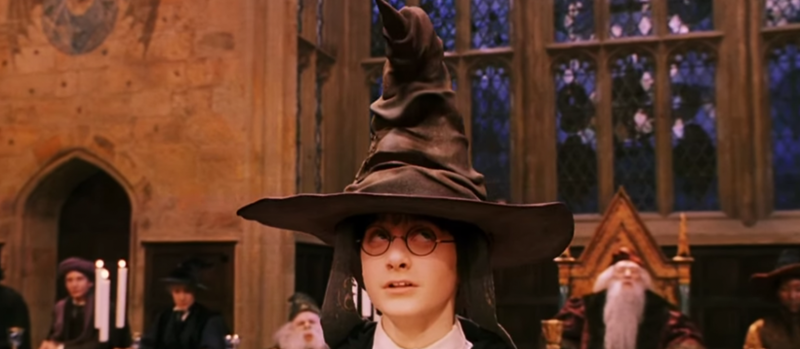
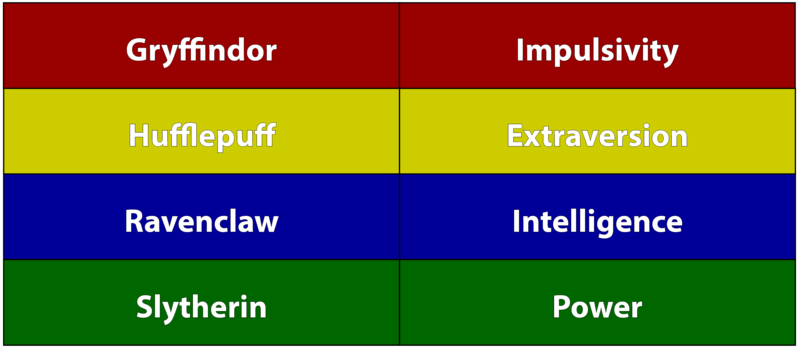
How can you make lab something that a student would look forward to each week? A little Harry Potter goes a long way. The smaller nature of lab allows me to sort people into small groups, so I bring in a Sorting Hat on the first day. Students pick from the hat to determine their House, and they’re seated near their Housemates. In case you are not familiar with Harry Potter, there are four Houses into which students are sorted—often, members of these Houses have common characteristics. I use the story’s frame to my advantage as an instructor. Students will explore a psychological construct relevant to their House for the duration of lab.
The Data Hallows
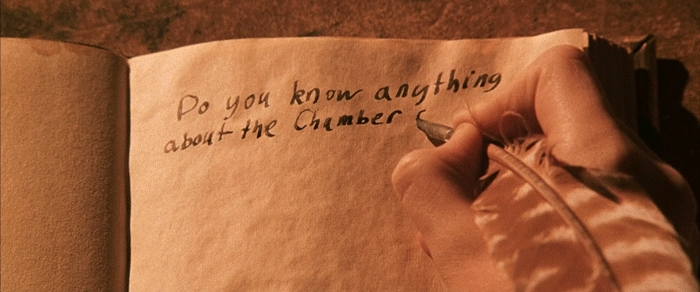
In the first week, Houses receive a short survey. They can add to it (with approval) and then collect data from around the university: about 45-50 participants per House. Since the research is not to be published and for educational purposes, our IRB requires no protocol, but you should check with yours.
All surveys should contain the following items: age, gender, grade point average, and any other scales you’d like to use as predictors. However, each House administers a survey that has unique items—5 items each from a validated scale involving their topic above. Hufflepuff might have a few items from the Big Five. Ravenclaw might have IQ-relevant questions. You could use whatever items you would like, but keep in mind that students are more interested by significant effects!
They have a week to collect these data, and then they return next lab to enter it into SPSS together. Students love this about the course, according to evaluations—they often touch upon the data collection. Their data is not invented, like every exercise they see in the book. It’s real! Learning statistics suddenly is no longer a hypothetical exercise; students can now take ownership and carry out their first study by following the course’s guidance. From day one, they’ve gone out into the world and collected new knowledge. And every lesson can unlock a new piece of the puzzle—a veritable alohomora.
This wizarding frame and their House dataset follow them throughout the course. Here were a few specific approaches I used with these critical elements to keep students interested.
Quizzing Whizbees
A nice thematic touch for giving quizzes is to allow 20 minutes to do something basic in SPSS (or your platform of choice). If you can make the quiz House-relevant, that’s even better. Remember, you do not have to change the data set for each House—just change the wording of the quiz question. For example, one of our quizzes involved correlation. For Ravenclaw House, the two variables were standardized test scores and number of books in the home—playing on Ravenclaw’s thirst for knowledge. Meanwhile, Hufflepuff students had conscientiousness and loyalty: two qualities the House values. The data sets, though, were numerically identical, so the quiz was equal in difficulty for both Houses.
Flourishes and Blots
I stress to my students that much of science flies or flops in the writing, and that I’ll be taking them through all the steps of the process. Writing assignments need not be long (2-3 pages), but they should be somewhat APA-structured: Introduction, Method, Results, and Discussion. Each paper tackles one question about the data they collected at the semester’s start: for example, what the typical participant is like, if there are gender differences, and potential relationships between their variable and GPA.
I give them an opportunity in lab to peer-edit rough drafts—I lead these sessions to teach them what to look for. Like our own process for publication, the students rely on their peers initially to catch glaring issues or limitations with the paper. It’s a friendly environment to introduce them to peer-review. But I still remind them that the final draft heads to the editor—me! At the end of the semester, each student should have three good papers to work with.
The House Cup
Writing these papers becomes meaningful, because at the end of the semester, some professors are gracious enough to hold a mock-conference in lecture. In the last weeks of lab, I teach students how to construct a poster from their paper(s) and present it—I encourage students to have fun with it. Each House chooses their favorite analyses. Professors can award points, extra credit, or prizes. I’ve found that students get very excited about their posters. I’m not sure I’ve gotten all the glitter off from last semester.
What’s interesting about using lecture time is that all five labs come together. Maybe Slytherin groups from all labs will have the same results. In that case, the professor can talk about reliability. If results differ, the professor can talk about difficulty in replication, something very topical to our science.
Fantastic Stats and Where to Find Them
With this structure, students conduct science, making the numbers about logic and truth rather than calculations. Statistics becomes a tool in their skillset, not an obstacle. By the end of class, students begin to learn about psychology from their peers—not passively from professors or assigned readings. They walk through each stage of our research process, from data collection to presentation. And many of them find that it is, well, kind of fun!
Rather than dreading statistics and avoiding it like the Dark Mark, they’ll begin to understand that statistics are a psychologist’s “most inexhaustible source of magic.” Maybe it won’t convert them all to statistics wizardry, but they’ll remember the course for years after.
Bio
Tom Tibbett is a PhD candidate in Social and Personality Psychology at Texas A&M University, graduating with an Advanced Statistics certification. He loves his alma mater, the College of William and Mary, where he graduated with a Bachelor’s degree in Psychology and English. His interests include teaching, number-crunching, puppies, and wizards. He can be contacted at [email protected].
Special Thanks
To my colleagues teaching PSYC 203, especially Heather Lench: you’ve been an inspiration and given me the foundation for these ideas. To Kaileigh Byrne: after meeting you, I don’t think I could avoid thinking about Harry Potter if I tried.
For more information
Conners, F. A., McCown, S. M., & Roskos-Ewoldsen, B. (1998). Unique challenges in teaching undergraduate statistics. Teaching of Psychology, 25, 40-42.
Hudak, M. A., & Anderson, D. E. (1990). Formal operations and learning styles predict success in statistics and computer science courses. Teaching of Psychology, 17, 231–234.
Sciutto, M. J. (1995). Student-centered methods for decreasing anxiety and increasing interest level in undergraduate statistics courses. Journal of Instructional Psychology, 22, 277–280.
Steele, J., James, J. B., Barnett, R.C. (2002). Learning in a man's world: Examining the perceptions of undergraduate women in male-dominated academic areas. Psychology of Women Quarterly, 26, 46–50.
Tibbett, T. P. (2017: January). Making statistics psychology: Engaging students with relevant applications. Presented at the National Institute on the Teaching of Psychology (NITOP) Annual Meeting.
Wilson, S. G. (2013). The flipped class: A method to address the challenges of an undergraduate statistics course. Teaching of Psychology, 10, 1-7.